

Analytics
Analytics in the sidebar shows how your experts are doing across every channel. Everyone in the workspace can open it.
Choose what to look at
- Range: 24h, 7 days (the default) or 30 days, always ending now.
- Expert: All experts, or one expert. With one expert picked, the page adds that expert’s success criteria and hides the per-expert splits.
If some conversations are still waiting to be analysed, a pill shows how many, for example “3 analyses waiting”.
Live now
The strip at the top lists calls and meetings in progress right now, and refreshes every 15 seconds. When nothing is live, it says so.
The tiles
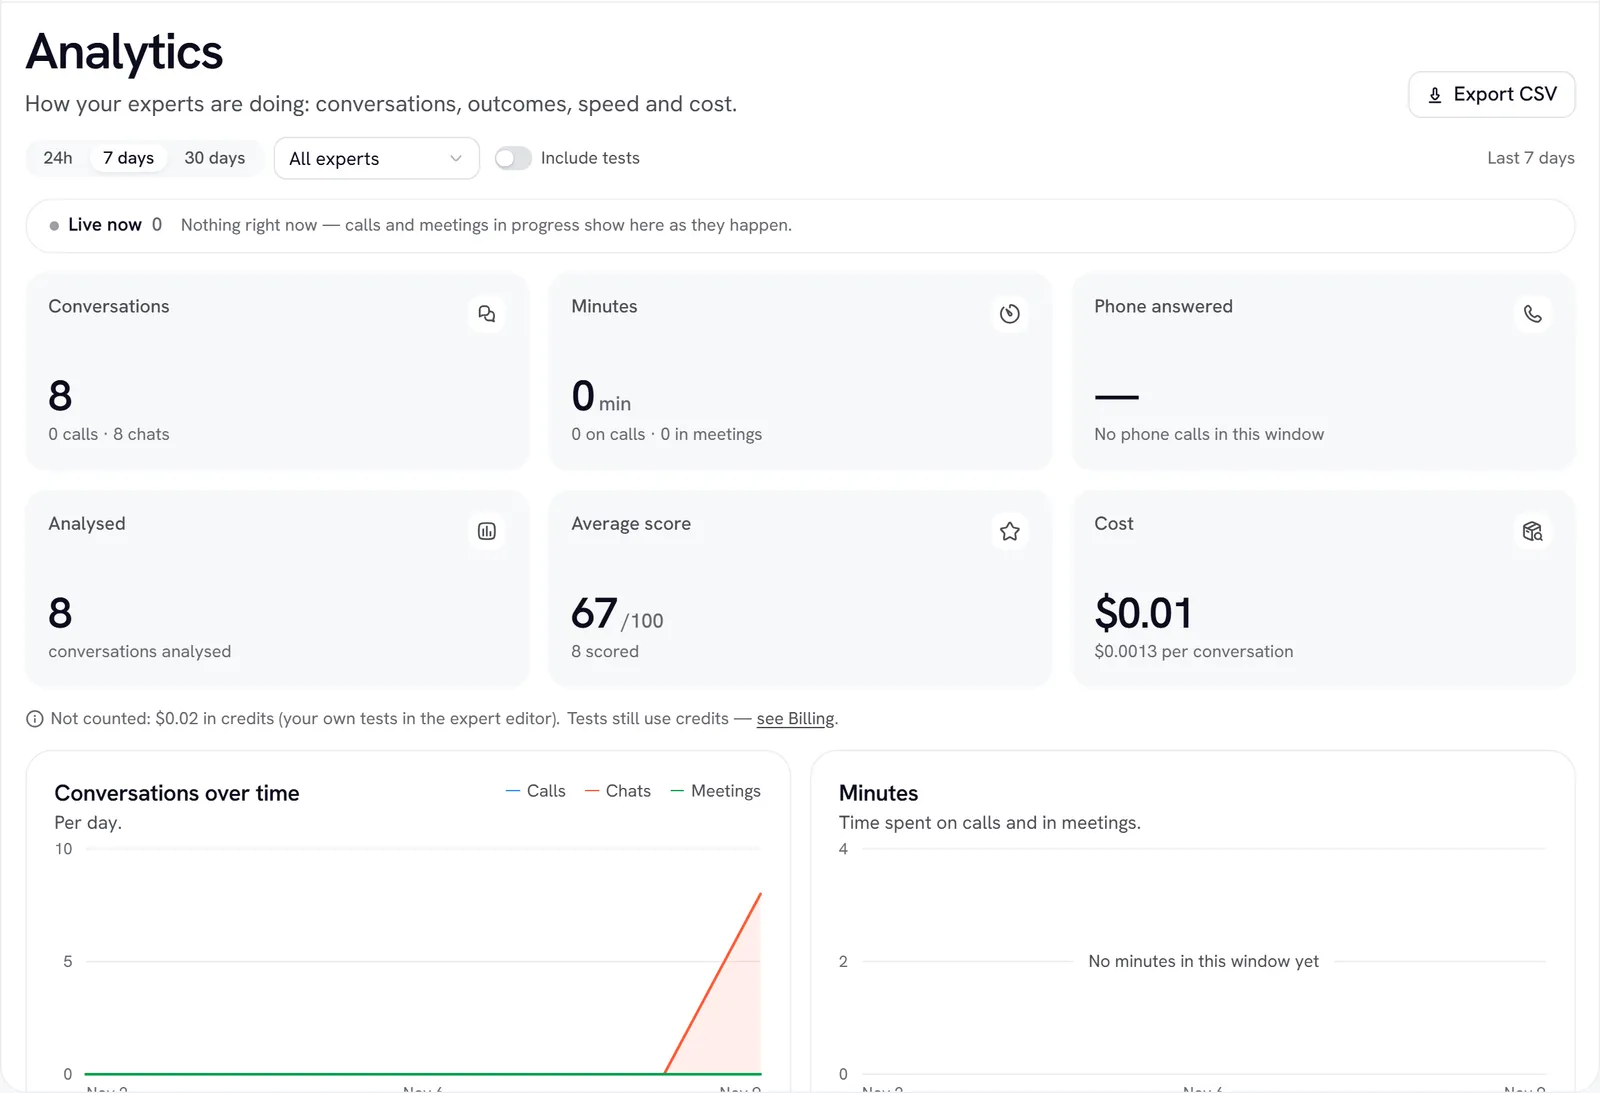
Deleted conversations are left out of the counts. Their minutes still count, because the usage happened.
Charts and breakdowns
- Conversations over time: calls, chats and meetings, by hour for short ranges and by day for longer ones.
- Minutes: time spent on calls and in meetings.
- Outcomes: how conversations ended, using the outcomes you defined in each expert’s analysis settings.
- Sentiment and score: positive, neutral, mixed and negative, with the Average quality score.
- By channel: chats, web calls, visitors, phone calls, meetings and the API.
- Success criteria: with one expert picked, how often each yes/no question was answered yes, no or unclear.
Outcomes, sentiment, scores and success criteria all come from post-call analysis. If an expert doesn’t have analysis switched on, these stay empty for it. See Conversations.
Response time
The Response time table shows, per expert:
- First reply: how long the expert took to answer the first time on a call;
- Each turn: how long it took to answer on later turns of a call;
- Chat reply: how long a text reply took.
Each cell shows the median, with the 95th percentile under it. Times up to 1 second are green and up to 3 seconds are amber. Rows marked (estimated) were timed from transcript timestamps, which include the length of the reply itself, so they read higher than real response times.
Visitor feedback
The Visitor feedback card covers what visitors told you on your share links and website widget:
- % helpful: the share of thumbs up among all ratings;
- By expert: the same split per expert, when all experts are shown;
- Latest comments: the newest written comments, each linking to its conversation. Select Show all to see more;
- Blocked messages: how many visitor messages safety screening blocked in the range.
Export
Admins can select Export CSV to download the analyses in the range: one row per analysed conversation, with its outcome, score, sentiment, summary, facts and success criteria. The export holds up to 10,000 rows.
Where else to look
- What you’re charged. Credits spent, by channel or by expert, are on Settings → Billing under Where credits went. See Billing.
- API traffic. Admins can see API requests and usage in Developers → Usage and Developers → Request log.
- Problems as they happen. Alerts tell admins when calls fail, phones go unanswered or tools break.
- Test results. Test runs don’t create conversations, so they never appear in Analytics. See Test suites.